
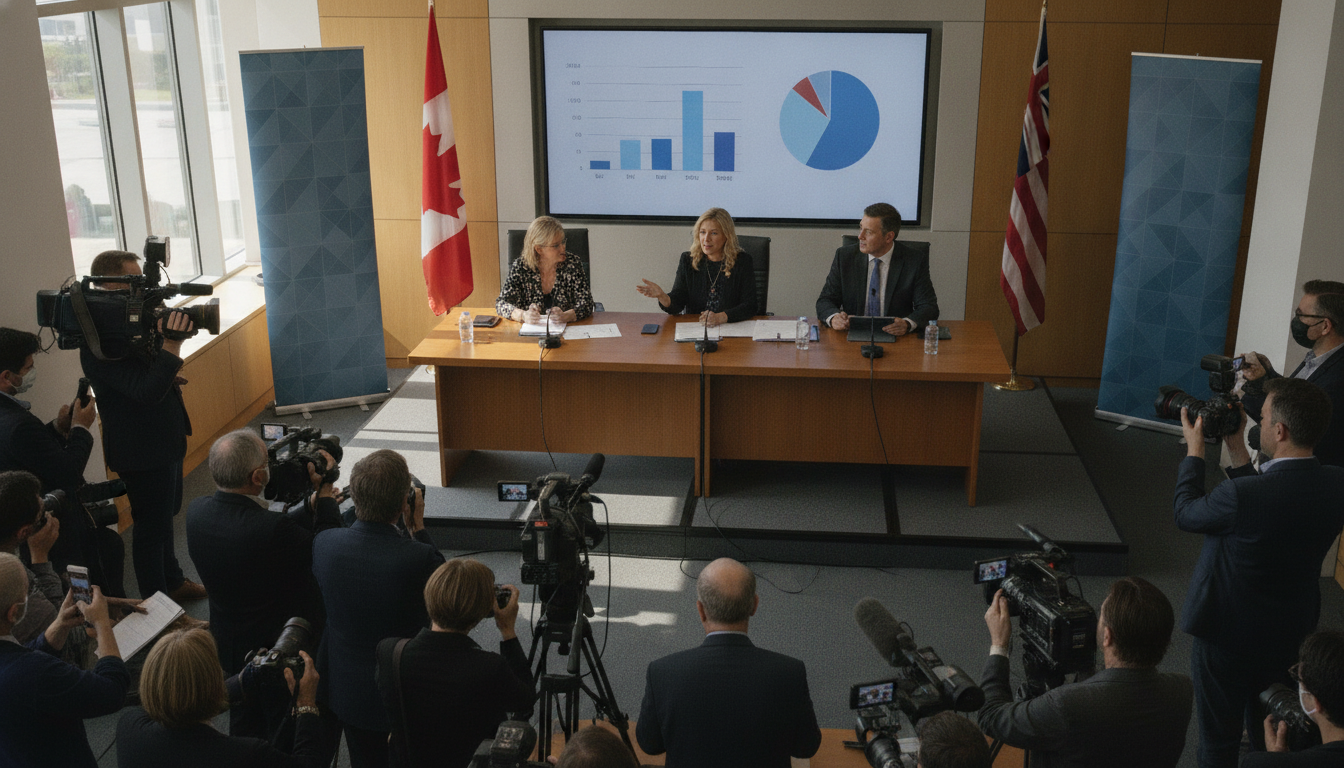
ThinkHQ survey of 1,100 Albertans highlights methodology and limits
ThinkHQ survey of 1,100 Albertans (July 16–21) used stratified sampling and StatsCan weighting, offering a timely snapshot of opinion in Alberta with caveats.
The ThinkHQ survey, completed by 1,100 Albertans between July 16 and July 21, provides a methodological snapshot of how the firm drew its sample and adjusted data to reflect provincial demographics. The poll used a random stratified sample of panellists supplied by panel partners and applied weighting to align results with gender, age, education and region benchmarks from Statistics Canada. The firm’s statement on sampling and weighting is now central as journalists, analysts and policymakers evaluate the survey’s relevance.
Survey Scope and Timing
The survey fieldwork took place over six days in mid-July, a period that can capture short-term shifts in public sentiment but may also reflect transient events. Short field windows reduce the chance that attitudes change during collection, but they increase sensitivity to news or incidents occurring inside that window. Because the sample was collected in a specific week, findings describe public opinion for the July 16–21 period and should be interpreted as a snapshot rather than a long-term trend.
Sampling and Panel Method
ThinkHQ reported using a random stratified sample drawn from panel partners rather than a probability-based household list. Stratified sampling means the firm set quotas across defined groups to ensure coverage of key subpopulations. Recruiting from established panels can boost efficiency and cost-effectiveness, but it also depends on the composition and recruitment methods of those partner panels. The company’s decision to draw a stratified sample reflects common industry practice for targeted provincial polling.
Weighting to Statistics Canada Benchmarks
The survey was weighted to reflect gender, age, education and region according to Statistics Canada, a standard step to correct imbalances between the sample and the population. Weighting adjusts respondent contributions so the final dataset better matches official demographic distributions. While weighting improves demographic representativeness, it cannot fully correct for differences between respondents and non-respondents on unmeasured traits, such as political engagement or media consumption habits.
Sample Size and Subgroup Precision
A total sample of 1,100 respondents provides a solid base for estimating province‑level opinion and is commonly used in provincial polling to achieve reasonable precision. For overall estimates, that sample size typically yields a margin of error in the range of roughly three percentage points at a 95 percent confidence level under simple random sampling assumptions. Analysts should note, however, that estimates for subgroups—such as specific age brackets or regions—will have substantially larger margins of error because the effective sample sizes for those slices are smaller.
Margin of Error and Design Effects
The headline margin of error depends on several factors beyond raw sample size, including the survey’s design effect and the variance of responses. Weighting can increase the design effect, meaning the true margin of error may be larger than the simple calculation suggests. ThinkHQ’s public materials do not list a design effect or exact response rate in the summary provided, so users of the data should treat point estimates with caution and avoid over-interpreting small differences between groups or over time.
Limitations Related to Panel Recruitment and Nonresponse
Panel-based polling carries risks of selection and nonresponse bias because panellists self-select to join panels and to participate in individual studies. Even with stratified recruitment and post‑collection weighting, those who join and respond to online panels may differ systematically from the broader population in ways that affect survey results. The absence of question wording, response rates and recruitment details in the brief summary makes it difficult to fully assess the potential direction or magnitude of such biases.
Transparency and Recommendations for Users
To better assess the validity of the ThinkHQ survey’s findings, observers should request the full methodological disclosure: questionnaire text, recruitment sources for panel partners, raw response and completion rates, weighting variables and weights, and any calculated design effect. Publication of crosstabs and demographic breakouts would also allow independent verification of patterns and the calculation of more accurate confidence intervals. Such transparency aligns with best practices for public opinion research and helps media and policymakers interpret results responsibly.
The ThinkHQ survey of 1,100 Albertans provides a timely, methodologically described snapshot of responses collected between July 16 and July 21, and its use of stratified sampling and Statistics Canada weighting conforms to common polling practice. At the same time, the survey’s reliance on panel partners, short collection window and the effects of weighting underline the importance of cautious interpretation, especially for subgroup comparisons and small shifts in reported percentages.
